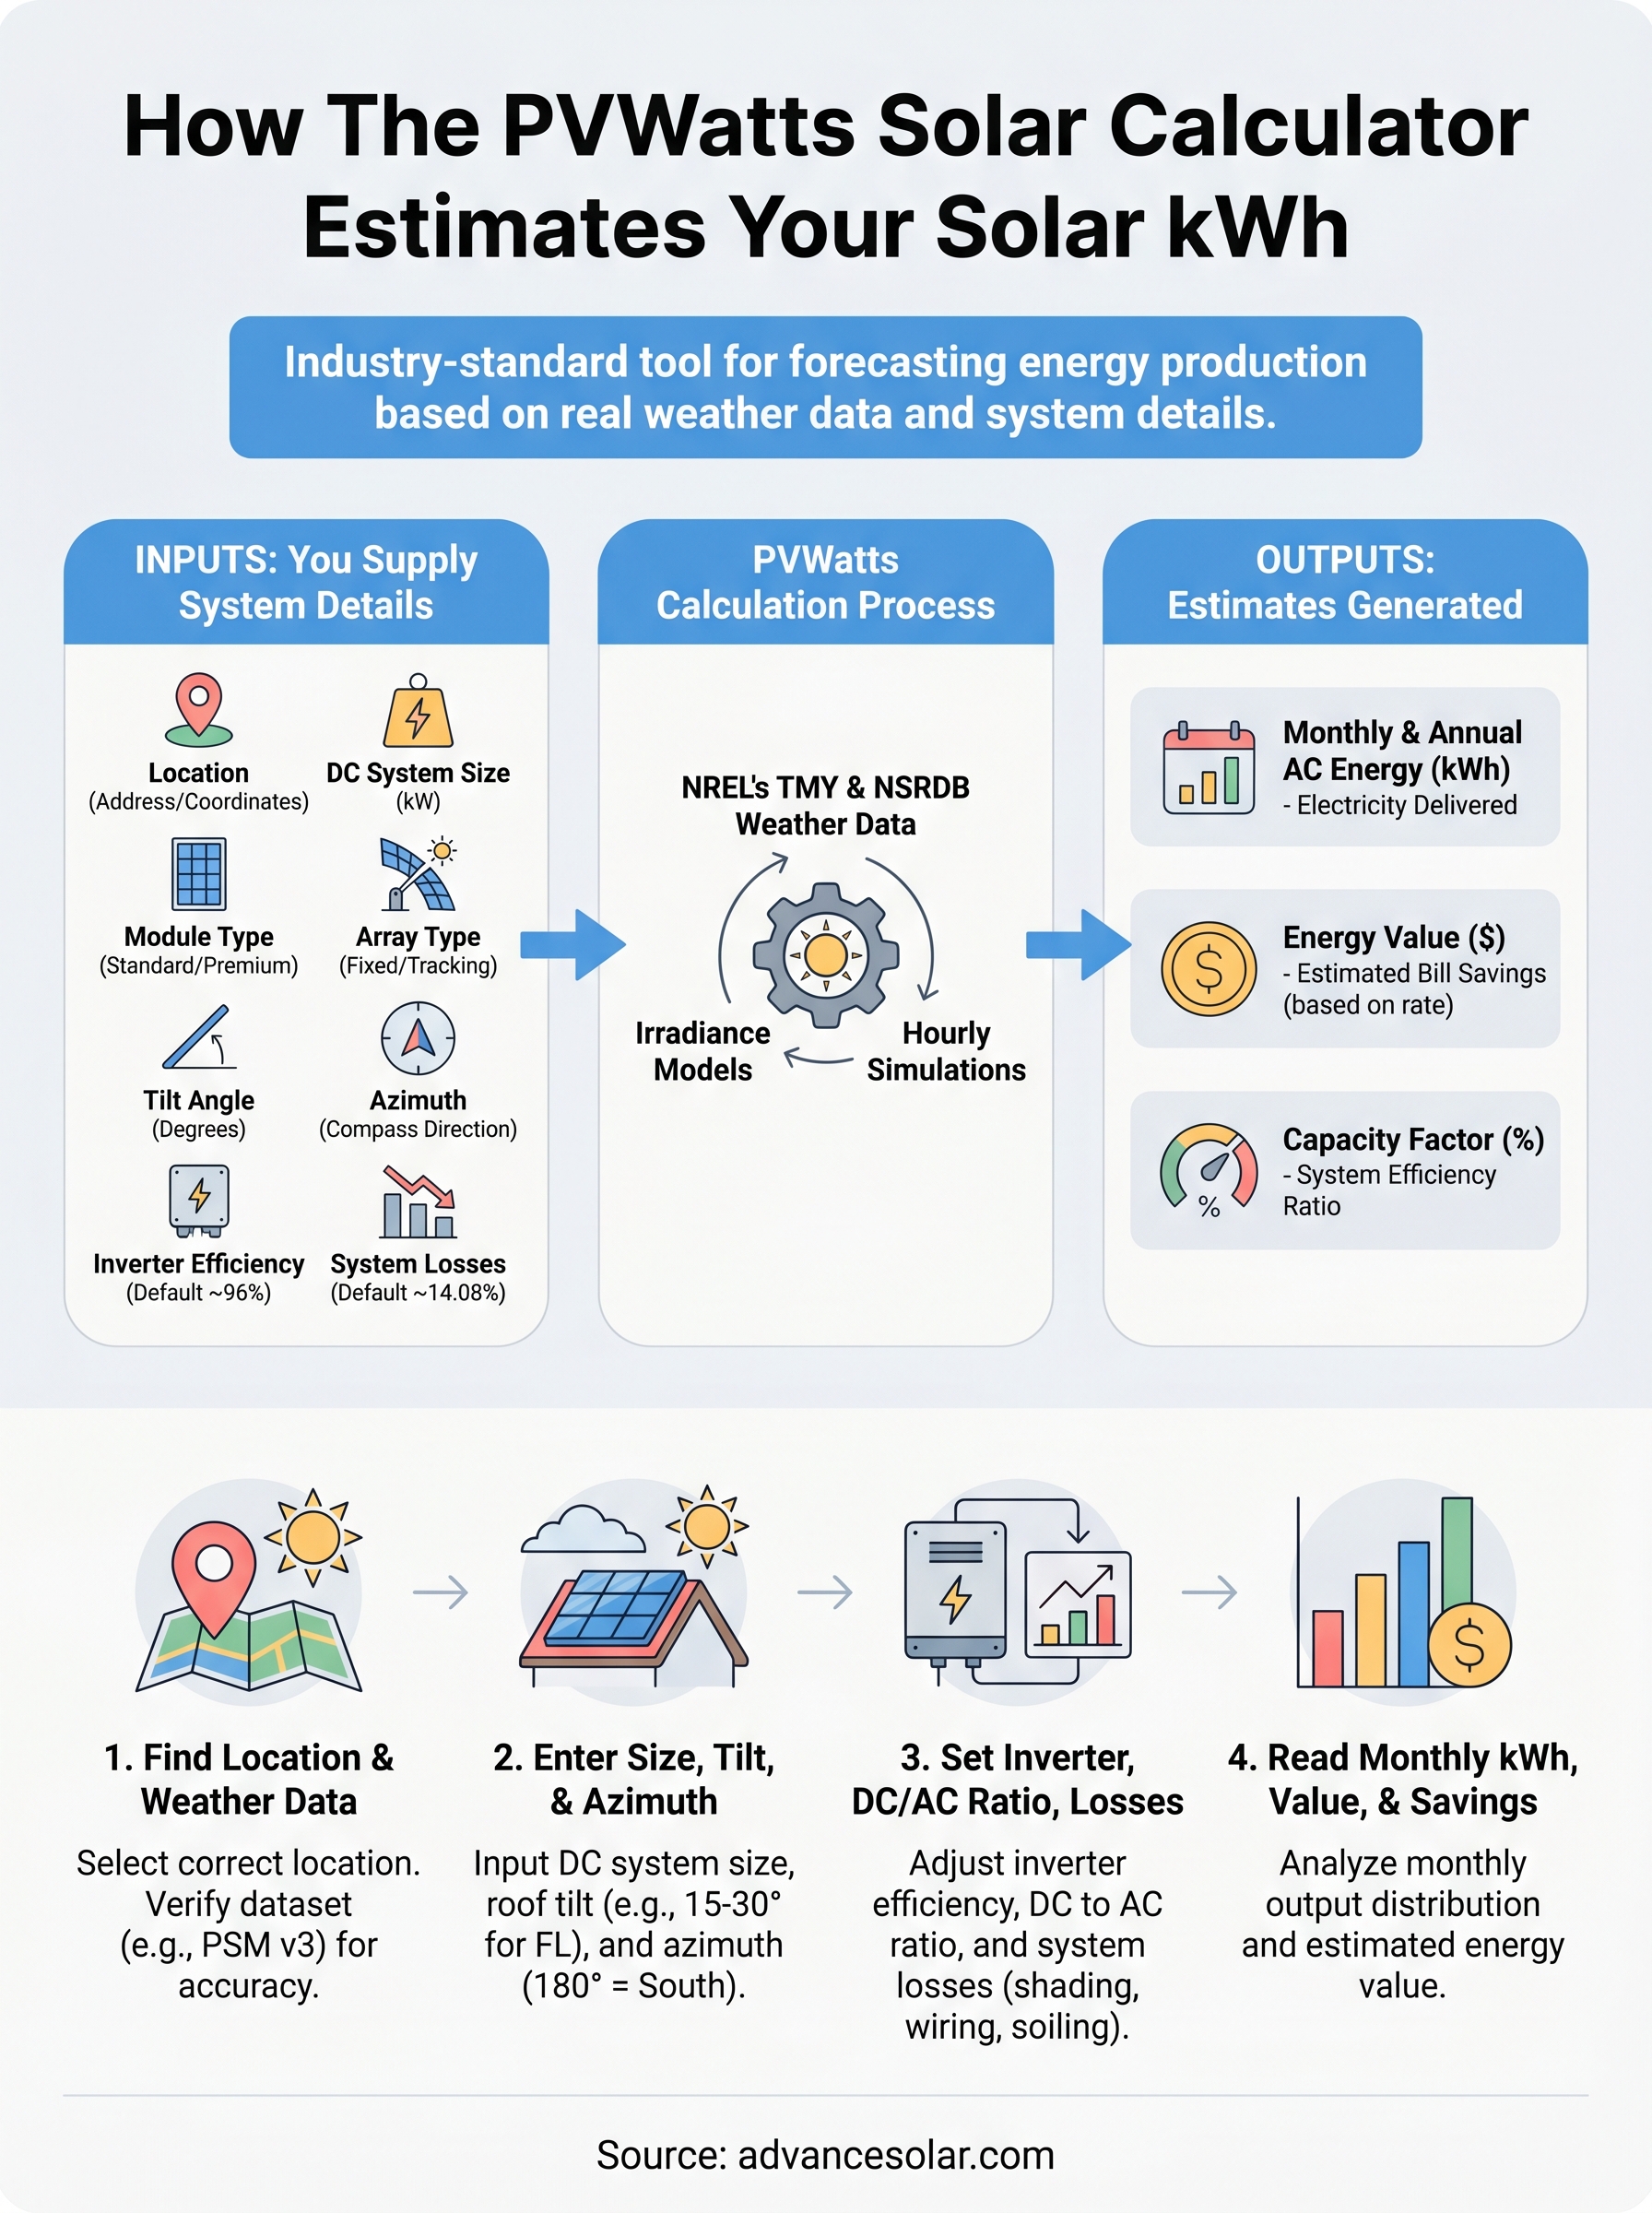
Before you sign a solar contract, you need a reliable way to estimate how many kilowatt-hours a system will actually produce on your roof. That’s exactly what the PVWatts solar calculator does. Built and maintained by the National Renewable Energy Laboratory (NREL), it’s the industry-standard tool that solar professionals and homeowners alike use to forecast energy production based on real weather data, system size, and your specific location.
The problem is, PVWatts gives you raw numbers without much explanation. It won’t tell you why it chose certain default values, how tilt angle affects your output in Southwest Florida versus the Panhandle, or where its estimates tend to be conservative. Understanding these details is what separates a rough guess from a confident investment decision, especially when you’re evaluating proposals from installers.
At Advance Solar & Spa, we’ve designed and installed over 50,000 solar energy systems across Florida since 1983. Our engineering team runs PVWatts calculations as part of every project proposal, then cross-references those numbers with decades of field data from real Florida rooftops. This guide walks you through exactly how PVWatts works, what each input means, where it falls short, and how to read its results like a professional so you can evaluate any solar quote with clarity.
What PVWatts estimates and what you must supply
PVWatts works as a one-way exchange: you supply the system details, and it returns energy production forecasts built from decades of solar radiation data collected at or near your location. Before you start entering numbers, understanding what you’re actually getting out of the tool versus what you’re putting in saves you from misreading the results. The pvwatts solar calculator does not size your system for you, nor does it account for site-specific shading from trees or neighboring buildings. It takes your inputs, runs them through NREL’s irradiance models, and returns monthly and annual estimates you can compare directly against your utility bills.
The outputs PVWatts generates
PVWatts returns three core result categories for any system you define. First, it shows monthly and annual AC energy output in kilowatt-hours, which is the most important figure because it tells you how much electricity the system will actually deliver to your home or business. Second, it calculates the dollar value of that energy based on a utility rate you set, giving you a rough savings projection tied to your real electricity cost. Third, it provides a summary of your system’s capacity factor, which is the ratio of actual output to the theoretical maximum if the panels ran at full rated power every hour of the year.
| Output | What it tells you |
|---|---|
| Monthly AC Energy (kWh) | How much electricity the system delivers each month |
| Annual AC Energy (kWh) | Total yearly production used to evaluate your proposal |
| Energy Value ($) | Estimated bill savings based on your electricity rate input |
| Capacity Factor (%) | System efficiency relative to its rated maximum output |
A capacity factor between 15% and 20% is typical for Florida rooftop solar systems, reflecting real-world losses from heat, intermittent cloud cover, and panel angle relative to the sun.
The inputs you must supply
PVWatts requires six primary inputs to run any calculation. These are: location (address or coordinates), system size in DC kilowatts, module type, array type, tilt angle, and azimuth (the compass direction your panels face). Each one affects the output significantly, and entering inaccurate values will produce forecasts that don’t match what your system will actually deliver on your specific roof. A 10-degree error in tilt or azimuth, for example, can shift your annual kWh estimate by 5% or more.
Two additional inputs refine the calculation further. The inverter efficiency field defaults to 96%, which is accurate for most modern string inverters and microinverters currently on the market. The system losses field defaults to 14.08% and captures real-world deductions including wiring resistance, soiling on the panel surface, mismatch between individual panels in the same string, and light-induced degradation during the first year of operation. You can adjust this number downward for a newer, well-maintained system, but the default is a reasonable and conservative starting point.
Here is a quick reference for what each required input controls:
| Input | What it controls |
|---|---|
| Location | Which weather dataset PVWatts pulls from NREL’s TMY database |
| DC System Size (kW) | Total panel nameplate capacity before inverter losses apply |
| Module Type | Temperature sensitivity coefficient for your panel technology |
| Array Type | Fixed roof mount, one-axis tracking, or ground mount configuration |
| Tilt (degrees) | Panel angle from horizontal, which shifts seasonal output distribution |
| Azimuth (degrees) | Panel compass direction, where 180° equals true south |
Understanding this input-output structure before you open the tool means you spend your time adjusting meaningful variables rather than guessing at defaults. The next steps walk through each input group in order, starting with the most location-critical decision you’ll make in the entire process.
Step 1. Find the right location and weather data
The first thing you do in the pvwatts solar calculator is enter your location, and this single step determines which weather dataset drives every number in your results. NREL pulls from its Typical Meteorological Year (TMY) database, which compiles decades of hourly solar radiation measurements into a single representative year for each geographic region. Getting this step right means your output forecasts reflect actual sun hours at your site, not averages from a station 50 miles away.
How PVWatts sources its weather data
PVWatts uses TMY3 and newer NSRDB (National Solar Radiation Database) files maintained by NREL. When you type in your address or drop a pin on the map, the tool automatically selects the nearest available weather station and displays it on screen. The NSRDB dataset, labeled "PSM v3" in the tool, covers most of the continental United States at a high spatial resolution and is the more accurate choice when it appears as an option for your location.
Always confirm the dataset label shown after entering your location. If "PSM v3" is available, select it over older TMY3 files because it uses finer grid resolution and more recent measurement periods.
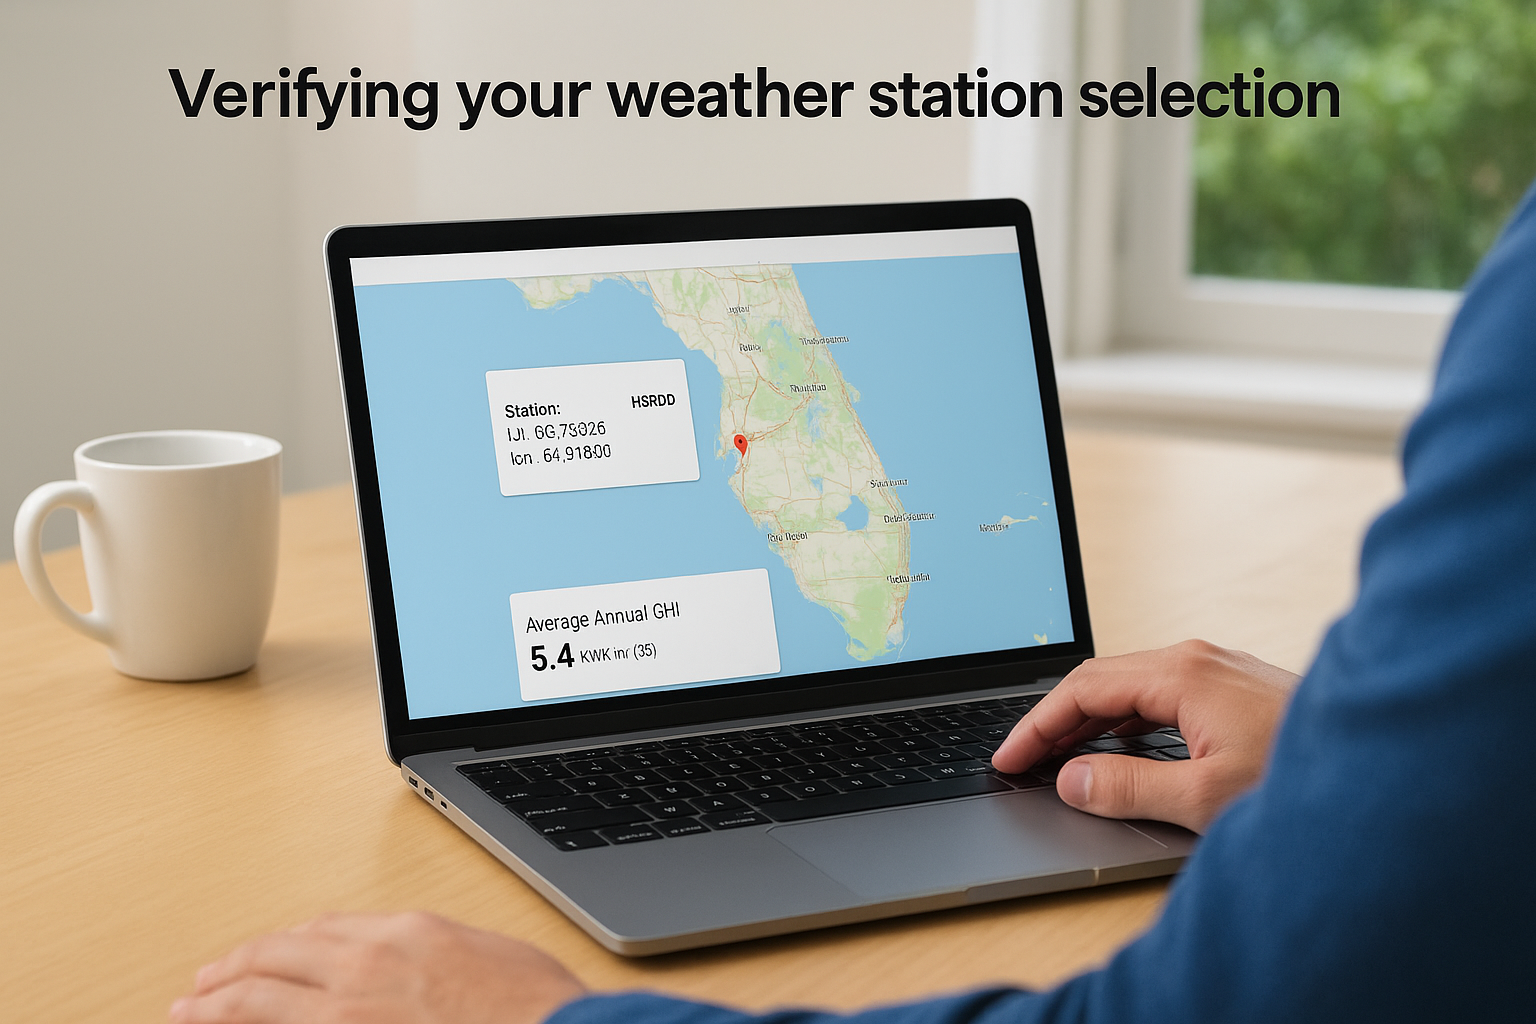
Verifying your weather station selection
Florida presents a specific challenge here: solar irradiance levels vary noticeably between the Gulf Coast, the Atlantic Coast, and inland areas, even within the same county. If you enter a Fort Myers address and PVWatts defaults to a station located in Sarasota, your annual kWh estimate could read 3-5% higher or lower than what your actual roof will produce. You need to check the station name and coordinates displayed in the results panel and compare them against your installation address before trusting any output.
For coastal Florida locations, use this checklist before moving to the next input step:
- Confirm the weather station is within 20 miles of your address
- Verify the dataset is PSM v3, not an older TMY2 or TMY3 file
- Check that the station is not located inland if your site sits within 5 miles of the coast, since coastal humidity and cloud patterns differ from interior areas
- Note the average annual GHI (Global Horizontal Irradiance) value shown, which should fall between 5.0 and 5.7 kWh/m²/day for most of Southwest Florida
Step 2. Enter system size, tilt, and azimuth
Once you confirm your location and weather dataset, you move to three inputs that define the physical layout of your system: DC system size, tilt angle, and azimuth. These three values work together to determine how much solar energy your panels can capture at your specific roof orientation. Getting them right is critical because the pvwatts solar calculator applies these values against the irradiance data for every hour of your TMY dataset, so small errors compound across 8,760 hours of simulation.
Setting your DC system size
Your DC system size is the total nameplate capacity of your solar panels in kilowatts, calculated by multiplying the number of panels by each panel’s rated wattage and dividing by 1,000. If a proposal lists twenty 400-watt panels, your DC system size is 8.0 kW. Enter this number directly into the "DC System Size (kW)" field. Do not enter your inverter’s AC output capacity here because that figure applies later in the losses section.
PVWatts also asks you to choose a module type, which affects how the model accounts for temperature-related efficiency losses. The three options are Standard (crystalline silicon), Premium (high-efficiency crystalline silicon), and Thin Film. Most residential proposals in Florida use crystalline silicon panels, so Standard is the correct selection for most homeowners. Choose Premium only if your installer has specified high-efficiency panels such as SunPower or REC Alpha series.
Choosing tilt and azimuth for your roof
Tilt is the angle of your panels measured from horizontal, and azimuth is the compass direction your panels face, expressed in degrees. For Florida rooftops, a tilt angle matching your roof pitch is the most practical entry because flush-mounted systems reflect real installation conditions. Most residential roofs in Florida fall between 15 and 30 degrees, so your tilt entry will usually land somewhere in that range.
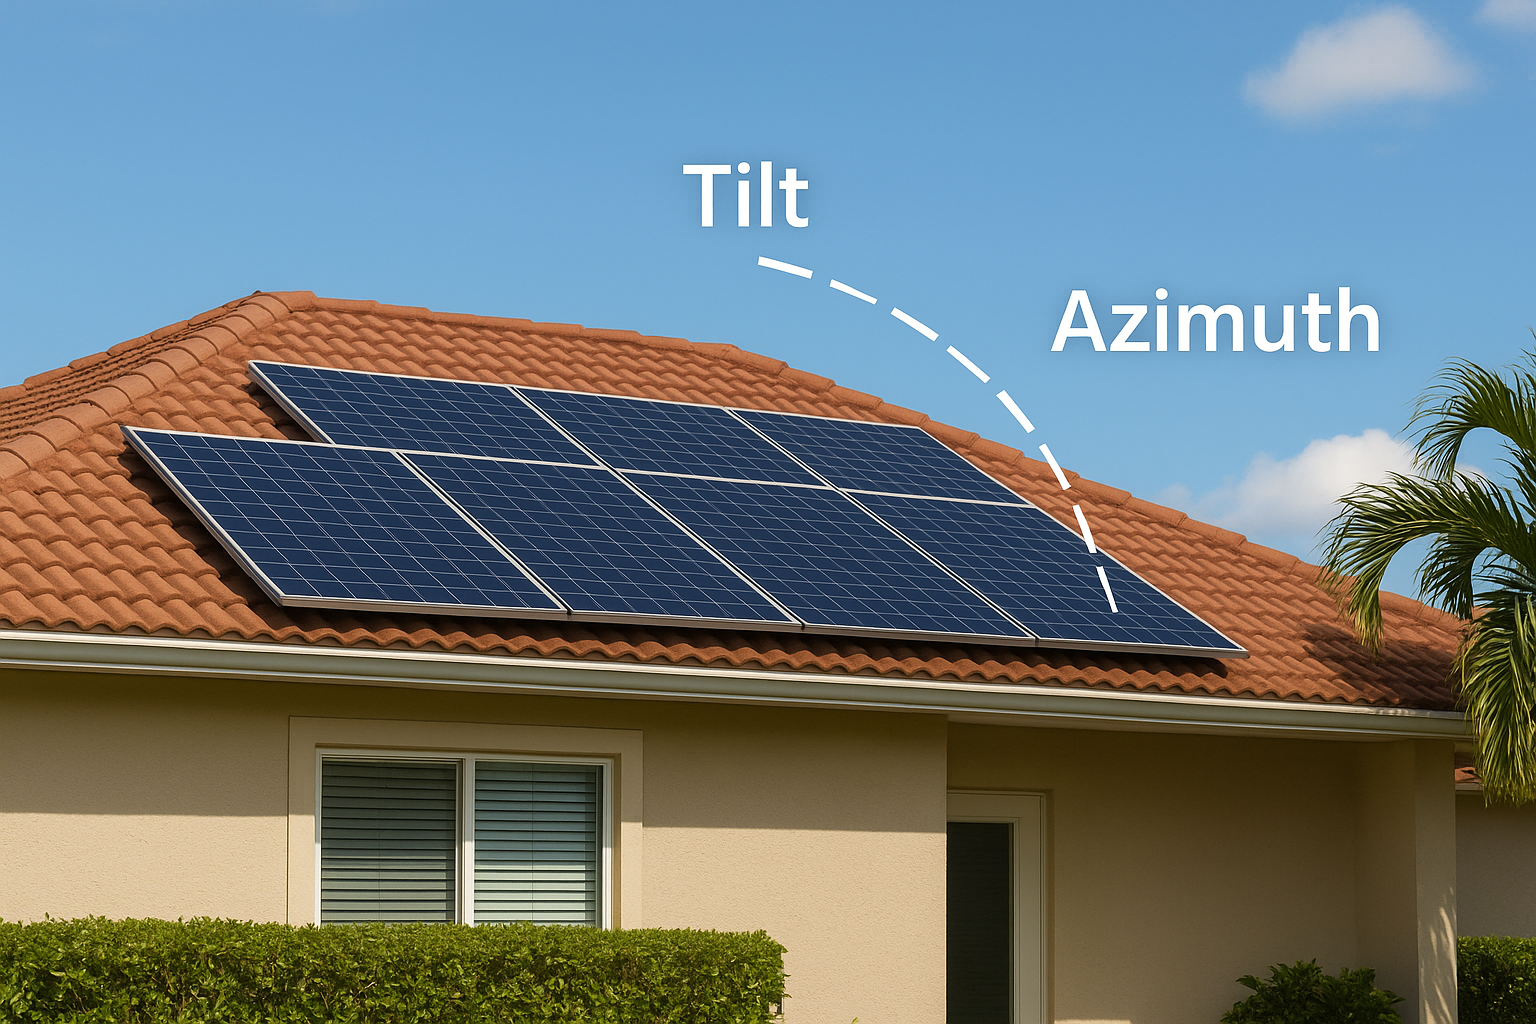
For Southwest Florida, a tilt of 22-26 degrees and an azimuth of 180 degrees (true south) typically produces the highest annual kWh output. Deviating 30 degrees east or west of true south reduces annual production by roughly 5-7%.
Use this reference table when entering your roof’s compass orientation:
| Roof Faces | Azimuth to Enter |
|---|---|
| True South | 180° |
| Southeast | 135° |
| Southwest | 225° |
| East | 90° |
| West | 270° |
If your roof faces east or west rather than south, your annual output will drop noticeably compared to a south-facing system. Enter the actual azimuth for your roof rather than defaulting to 180 degrees, because an honest forecast gives you a more useful baseline for evaluating any installer’s proposal.
Step 3. Set inverter, DC to AC ratio, losses
After you lock in your physical system layout, the pvwatts solar calculator asks for three more inputs that model real-world performance degradation: inverter efficiency, DC to AC size ratio, and system losses. These inputs translate the raw energy your panels capture into the actual AC electricity your home or business can use. Skipping past the defaults here is a common mistake that leads to forecasts that don’t match real system output.
Inverter efficiency
PVWatts defaults inverter efficiency to 96%, and for most modern inverters this number is accurate. String inverters from manufacturers like SMA and SolarEdge typically publish efficiency ratings between 97% and 98.5%, while microinverters from Enphase land around 97%. You can enter your specific inverter’s rated efficiency from its datasheet if your installer has confirmed the equipment, but adjusting within the 96-98% range will change your annual kWh output by only 1-2%, so the default is a defensible starting point for initial estimates.
If your installer specifies a lower-efficiency inverter below 94%, update this field before comparing output forecasts between proposals, because even a 2-point difference in inverter efficiency shifts your annual production estimate by roughly 200-400 kWh on a 10 kW system.
DC to AC ratio
The DC to AC ratio compares your total panel nameplate capacity to your inverter’s rated AC output capacity. PVWatts defaults this value to 1.2, meaning a 10 kW DC array paired with an 8.33 kW AC inverter. This ratio reflects standard industry practice because panels rarely operate at their rated peak output under real-world conditions, so slightly undersizing the inverter improves overall system economics without meaningfully clipping production.
If your proposal includes a 10 kW panel array and a 10 kW inverter (a 1.0 ratio), enter 1.0 to avoid overstating your forecast. Most Florida installations fall between 1.1 and 1.3, so use the actual ratio from your proposal rather than the default when you have the numbers available.
System losses
System losses account for all the small efficiency reductions that happen between sunlight hitting your panels and electricity reaching your breaker panel. PVWatts breaks these into individual categories you can adjust:
| Loss Category | Default Value | Notes |
|---|---|---|
| Soiling | 2.0% | Dust and debris on panel surface |
| Shading | 3.0% | Adjust to 0% only if site is fully unshaded |
| Wiring | 2.0% | DC and AC conductor resistance |
| Mismatch | 2.0% | Output variation between panels in a string |
| Light-induced degradation | 1.5% | First-year efficiency drop in crystalline silicon |
| Nameplate rating | 1.0% | Panel output tolerance from manufacturer |
| Age | 0.0% | Increase for older systems with known degradation |
The combined default total of 14.08% is a reasonable and conservative figure for a new Florida installation. You can lower soiling losses slightly if your roof pitch exceeds 20 degrees, since rain clears panels more effectively on steeper surfaces, but avoid reducing the total below 12% without site-specific data to back the adjustment.
Step 4. Read monthly kWh, value, and savings
Once you run the pvwatts solar calculator with all your inputs confirmed, the results page loads a table showing monthly AC energy output, energy value, and a full annual summary. This is the section most homeowners scan too quickly. Taking five minutes to read it correctly tells you whether a solar proposal is sized appropriately for your actual usage or whether an installer is pitching a system that over- or under-produces for your specific roof and consumption pattern.
Understanding the monthly output table
PVWatts breaks your annual production into twelve monthly rows, each showing the AC energy your system is forecast to generate in kilowatt-hours. In Florida, you’ll notice the numbers are not evenly distributed across the year. Summer months like June and July show high irradiance but often produce less than peak spring months like March and April because of afternoon cloud cover and higher ambient temperatures that reduce panel efficiency. A well-calibrated estimate for a south-facing 10 kW system in Fort Myers, for example, might show roughly 1,350 kWh in March but closer to 1,200 kWh in July.
| Month | Example 10 kW Output (kWh) | Notes |
|---|---|---|
| January | 1,050 | Shorter days, lower sun angle |
| March | 1,350 | Peak spring irradiance |
| June | 1,220 | Long days, heat reduces efficiency |
| September | 1,150 | High humidity, afternoon storms |
| December | 950 | Lowest output of the year |
Converting output to dollar savings
The energy value column multiplies each month’s kWh output by the utility rate you entered. If you set your rate at $0.14 per kWh and your system produces 1,200 kWh in a given month, PVWatts shows $168 in value for that month. Compare this figure directly against the same month on your actual utility bill to see how much of your bill the system offsets.
Do not use the default $0.10/kWh rate that PVWatts pre-fills. Pull your actual rate from a recent Florida utility bill, which for most Florida Power & Light and Duke Energy customers currently runs between $0.12 and $0.16 per kWh, including all fixed fees spread across your total consumption.
Your annual total row at the bottom of the results table is the single number most installers quote in their proposals. Cross-reference it against your last 12 months of utility consumption before accepting any production guarantee in a contract.
Next Steps for a Solar Estimate
Running the pvwatts solar calculator gives you a solid production forecast, but a number on a screen is only as useful as the real-world context behind it. PVWatts cannot account for your specific roof shading, local utility rate structures, available incentives, or the exact equipment your installer plans to use. Those factors shift the final savings figure significantly, and closing that gap requires a professional site assessment.
Take your PVWatts annual kWh output and compare it directly against your last 12 months of utility bills. Note which months show the largest gap between your usage and your forecast production, since those months will determine whether battery storage makes sense for your situation. Bring those numbers to your consultation so you can ask specific questions about system sizing and offset percentages.
If you’re ready to move from estimates to a real proposal, get a free solar consultation from Advance Solar & Spa and put your numbers to work.